It’s been a while since my last blog post. Indeed, my free time is used to improve packages like “{fusen}: Inflate your package from a simple flat Rmd” , “{attachment}: Tools to deal with dependencies in scripts, Rmd and packages” or “{gitlabr}: An R client for the GitLab API”. Hence, drawing some maps is not on my high priority list. But today, I had to do a little trick with {tmap} that I wanted to share.
Get some point data
Let is use the data included in {tmap} with the population size of cities in the World.
I will only use the iso_a3 values to separate my cities into different symbols appearance. This is not really useful in this case, but, at least, this is a reproducible example.
library(dplyr)
library(sf)
library(tmap)
library(stringr)
library(tidyr)
library(purrr)

data(World)
data(metro)

metro_small <- metro %>%
  select(name_long, iso_a3)
metro_small
## Simple feature collection with 436 features and 2 fields
## Geometry type: POINT
## Dimension: XY
## Bounding box: xmin: -123.1193 ymin: -37.814 xmax: 174.7667 ymax: 60.16925
## Geodetic CRS: WGS 84
## First 10 features:
## name_long iso_a3 geometry
## 2 Kabul AFG POINT (69.17246 34.52889)
## 8 El Djazair (Algiers) DZA POINT (3.04197 36.7525)
## 13 Luanda AGO POINT (13.23432 -8.83682)
## 16 Buenos Aires ARG POINT (-58.40037 -34.60508)
## 17 Cordoba ARG POINT (-64.18105 -31.4135)
## 25 Rosario ARG POINT (-60.63932 -32.94682)
## 32 Yerevan ARM POINT (44.51462 40.182)
## 33 Adelaide AUS POINT (138.5986 -34.92866)
## 34 Brisbane AUS POINT (153.0281 -27.46794)
## 37 Melbourne AUS POINT (144.9633 -37.814)Too Long; Didn’t read
As of today, it is not possible to define different border colours and sizes for the same point layer in {tmap}.
- Create your own symbology
- Join your map with the symbology
- Separate your layer depending on the borders types
- Combine layers
- Add a custom manual legend
# A custom company symbology
symbology <-tribble(
~city_letter, ~color, ~border_color, ~border_width,
"A-start", "cyan", "black", 0.5,
"D-start", "orangered", "transparent", 0,
"Others", "white", "forestgreen", 1,
"Extra not used", "black", "cyan", 1,
)
# Combine my layer to my symbology
metro_small_symbology <- metro_small %>%
mutate(city_letter = case_when(
str_starts(iso_a3, "A") ~ "A-start",
str_starts(iso_a3, "D") ~ "D-start",
TRUE ~ "Others"
)) %>%
left_join(symbology, by = "city_letter")
#' Create a custom symbol layer with no legend
#'
#' @param data sf layer with column 'city_letter' at least
#' @param border_color A unique color value
#' @param border_width A unique width value
#' @param my_palette a named vector of colours associated to 'city_letter'
my_layer_point_border_no_legend <- function(data,
border_color,
border_width,
my_palette) {
tm_shape(data) +
tm_symbols(col = "city_letter",
palette = my_palette,
border.col = border_color,
border.lwd = border_width,
legend.col.show = FALSE,
size = 0.5)
}
# Define a color palette
my_palette <- setNames(symbology[["color"]], symbology[["city_letter"]])
# Full pipe creation of tmap layers by border types
metro_small_tmap_layer <-
metro_small_symbology %>%
# nest
nest(data = -c(border_color, border_width)) %>%
# Calculate tmap shapes
mutate(tm_layer =
pmap(list(data, border_color, border_width), my_layer_point_border_no_legend, my_palette = my_palette)) %>%
pull(tm_layer) %>%
reduce(`+`)
# Create symbology from the original layer
layer_symbology <- metro_small_symbology %>%
st_drop_geometry() %>%
distinct(city_letter, color, border_color, border_width)
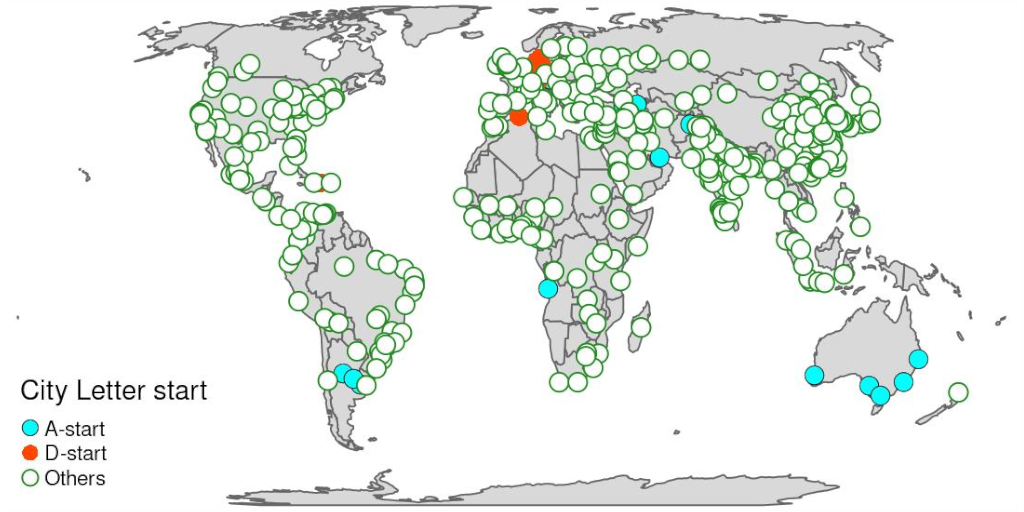
# Draw the map
tm_shape(World) +
tm_polygons() +
metro_small_tmap_layer + # layer with points
tm_add_legend(type = "symbol",
title = "City Letter start",
labels = layer_symbology[["city_letter"]],
col = layer_symbology[["color"]],
border.col = layer_symbology[["border_color"]],
border.lwd = layer_symbology[["border_width"]]
)
Create a symbology
You can create a symbology for each layer group to draw.
This symbology could be used for all your projects on the same subject.
In my case, I will create a symbology related to the first letter of the iso_a3 code:
- Cities with
iso_a3starts withAwill be a blue circle, with a dark border of width 1. - Cities with
iso_a3starts withDwill be a red circle, with a transparent border of width 0. - All other cities will be a white circle, with a green border of width 3.
- I create an extra symbology, that will not be used in this example but could be used later. This is to illustrate what is happening next.
symbology <-tribble(
  ~city_letter, ~color, ~border_color, ~border_width,
  "A-start", "cyan", "black", 0.5,
  "D-start", "orangered", "transparent", 0,
  "Others", "white", "forestgreen", 1,
  "Extra not used", "black", "cyan", 1,
)
symbology
## # A tibble: 4 × 4
## city_letter color border_color border_width
## <chr> <chr> <chr> <dbl>
## 1 A-start cyan black 0.5
## 2 D-start orangered transparent 0
## 3 Others white forestgreen 1
## 4 Extra not used black cyan 1Now I can associate my symbology to my layer:
- First I need to create a new column that will correspond to
city_lettercolumns of the symbology. - Second, I can join the symbology to my layer
metro_small_symbology <- metro_small %>%
  mutate(city_letter = case_when(
    str_starts(iso_a3, "A") ~ "A-start",
    str_starts(iso_a3, "D") ~ "D-start",
    TRUE ~ "Others"
  )) %>%
  left_join(symbology, by = "city_letter")
metro_small_symbology
## Simple feature collection with 436 features and 6 fields
## Geometry type: POINT
## Dimension: XY
## Bounding box: xmin: -123.1193 ymin: -37.814 xmax: 174.7667 ymax: 60.16925
## Geodetic CRS: WGS 84
## First 10 features:
## name_long iso_a3 city_letter color border_color border_width
## 1 Kabul AFG A-start cyan black 0.5
## 2 El Djazair (Algiers) DZA D-start orangered transparent 0.0
## 3 Luanda AGO A-start cyan black 0.5
## 4 Buenos Aires ARG A-start cyan black 0.5
## 5 Cordoba ARG A-start cyan black 0.5
## 6 Rosario ARG A-start cyan black 0.5
## 7 Yerevan ARM A-start cyan black 0.5
## 8 Adelaide AUS A-start cyan black 0.5
## 9 Brisbane AUS A-start cyan black 0.5
## 10 Melbourne AUS A-start cyan black 0.5
## geometry
## 1 POINT (69.17246 34.52889)
## 2 POINT (3.04197 36.7525)
## 3 POINT (13.23432 -8.83682)
## 4 POINT (-58.40037 -34.60508)
## 5 POINT (-64.18105 -31.4135)
## 6 POINT (-60.63932 -32.94682)
## 7 POINT (44.51462 40.182)
## 8 POINT (138.5986 -34.92866)
## 9 POINT (153.0281 -27.46794)
## 10 POINT (144.9633 -37.814)Map points with different colours
I can use the symbology to map my points with different colours according to column city_letter.
tm_shape(World) +
    tm_polygons() +
tm_shape(metro_small_symbology) +
    tm_symbols(col = "city_letter")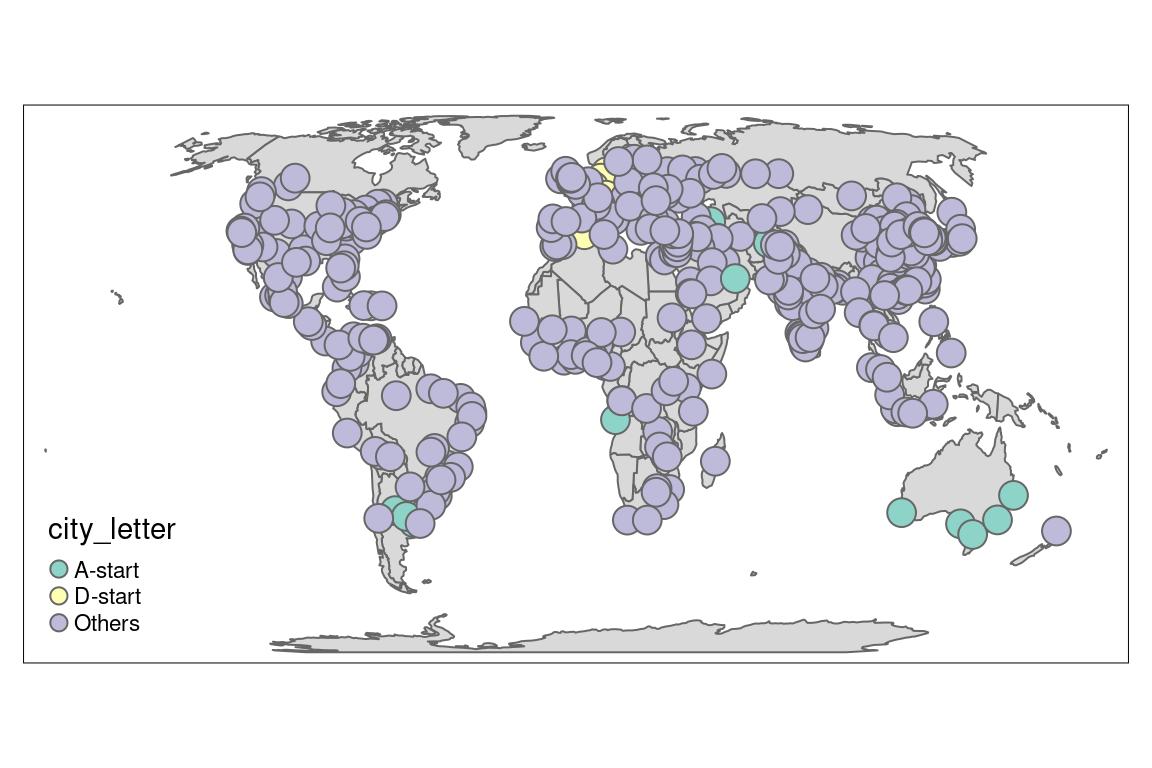
I can change my default palette to use my own symbology. To do so, I need a named vector in the palette argument from my symbology.
my_palette <- setNames(symbology[["color"]], symbology[["city_letter"]])

tm_shape(World) +
    tm_polygons() +
tm_shape(metro_small_symbology) +
    tm_symbols(col = "city_letter", palette = my_palette)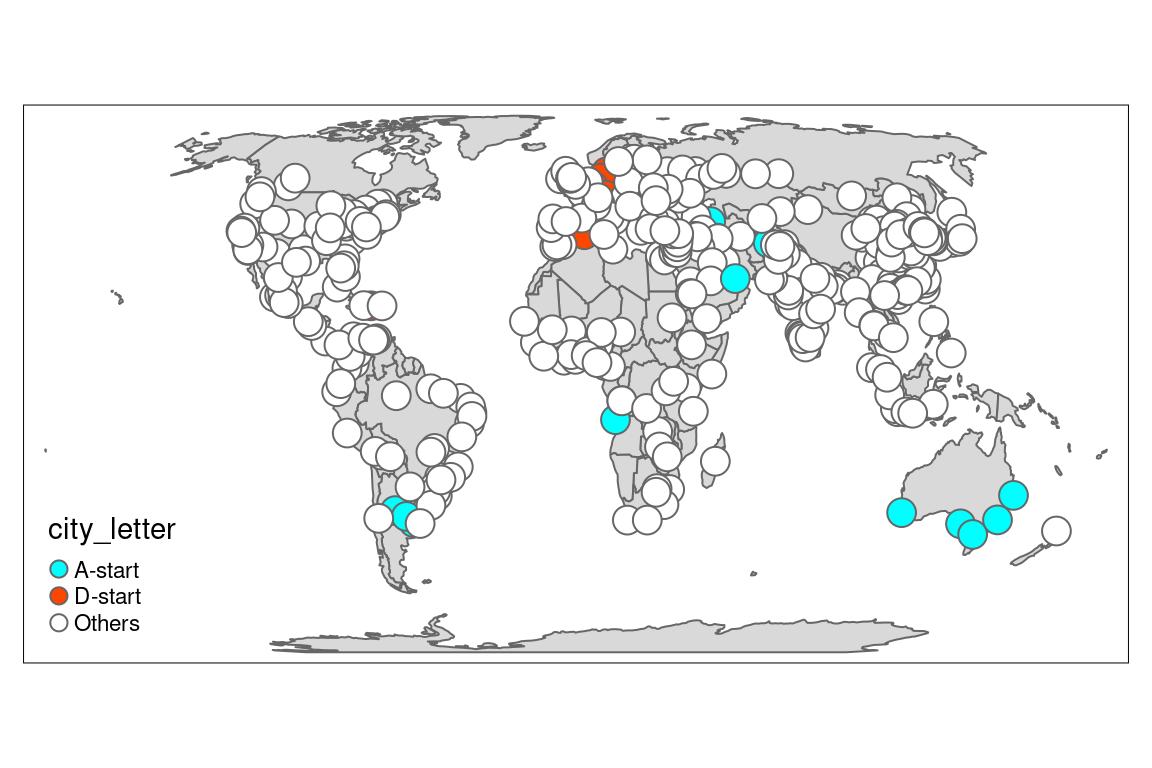
Map points with different colours and borders
As of today, it is not possible to define different border colours and sizes for the same point shape in {tmap}.
Indeed, border.col argument requires only one value. The exemple below can not work as expected.
my_palette <- setNames(symbology[["color"]], symbology[["city_letter"]])

tm_shape(World) +
    tm_polygons() +
tm_shape(metro_small_symbology) +
    tm_symbols(col = "city_letter", palette = my_palette,
               border.col = symbology[["border_color"]])
## Warning in if (is.na(symbol.border.col)) {: la condition a une longueur > 1 et
## seul le premier élément est utilisé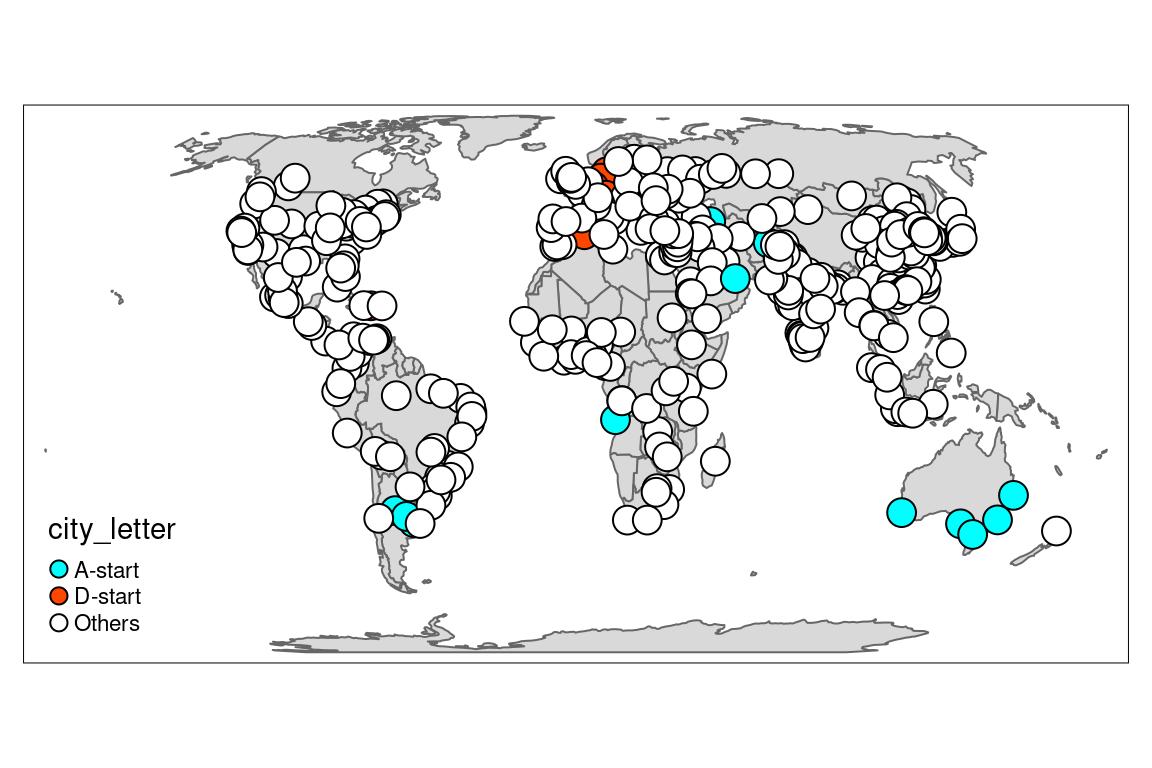
Hence, we need to
- separate the dataset, according to border types,
- draw the layer for each type
- create a combined legend manually
We can nest the {sf} object to create our 3 layers types, according to borders types.
metro_small_symbology_nested <- metro_small_symbology %>%
  nest(data = -c(border_color, border_width))

metro_small_symbology_nested
## # A tibble: 3 × 3
## border_color border_width data
## <chr> <dbl> <list>
## 1 black 0.5 <sf [14 × 5]>
## 2 transparent 0 <sf [7 × 5]>
## 3 forestgreen 1 <sf [415 × 5]>We can create a function that can draw a layer with define borders
#' A custom symbol layer
#'
#' @param data sf layer with column 'city_letter' at least
#' @param border_color A unique color value
#' @param border_width A unique width value
#' @param my_palette a named vector of colours associated to 'city_letter'
my_layer_point_border <- function(data,
                                  border_color,
                                  border_width,
                                  my_palette) {
  tm_shape(data) +
    tm_symbols(col = "city_letter",
               palette = my_palette,
               border.col = border_color,
               border.lwd = border_width)
}

# example
my_layer_point_border(metro_small_symbology, border_color = "red", border_width = 3, my_palette = my_palette)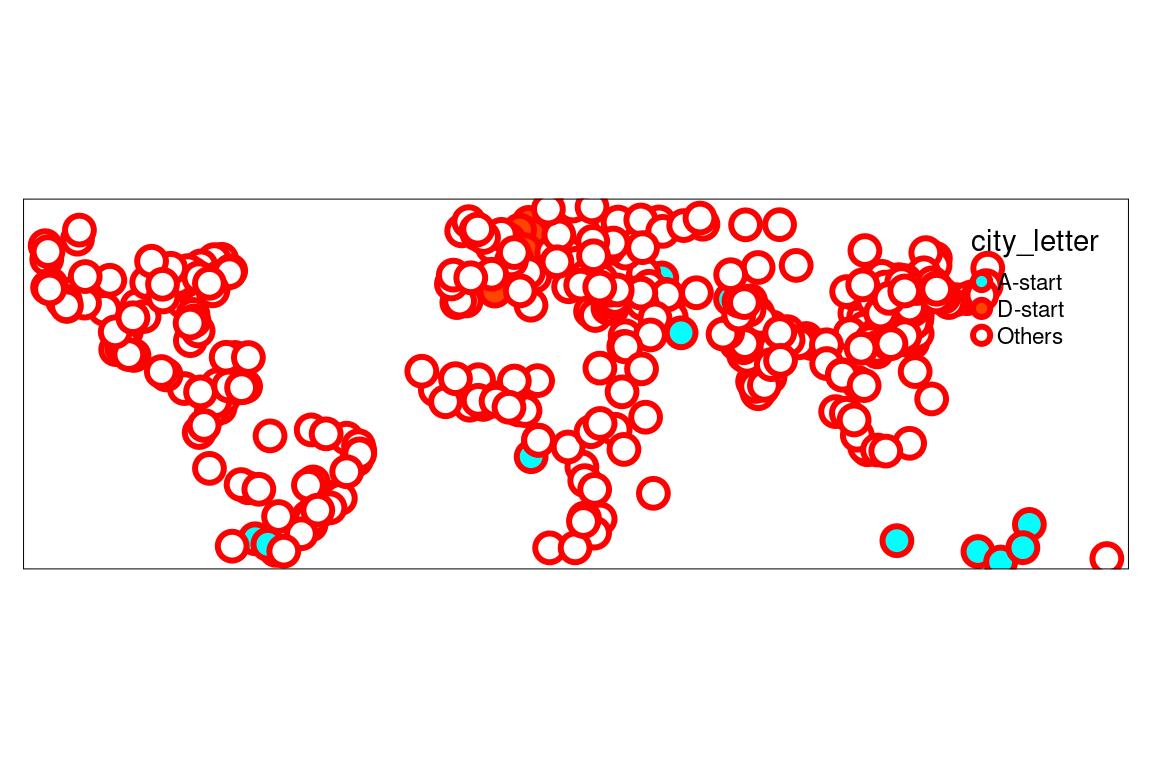
And now, we can apply this function to the nested dataset.
metro_small_symbology_nested_tmap <-
  metro_small_symbology_nested %>%
  mutate(tm_layer =
           pmap(list(data, border_color, border_width), my_layer_point_border, my_palette = my_palette))

metro_small_symbology_nested_tmap
## # A tibble: 3 × 4
## border_color border_width data tm_layer
## <chr> <dbl> <list> <list>
## 1 black 0.5 <sf [14 × 5]> <tmap>
## 2 transparent 0 <sf [7 × 5]> <tmap>
## 3 forestgreen 1 <sf [415 × 5]> <tmap>Then, extract the column created, combine and draw the layers, independantly …
metro_small_symbology_borders <- metro_small_symbology_nested_tmap[["tm_layer"]] %>%
  reduce(`+`)

metro_small_symbology_borders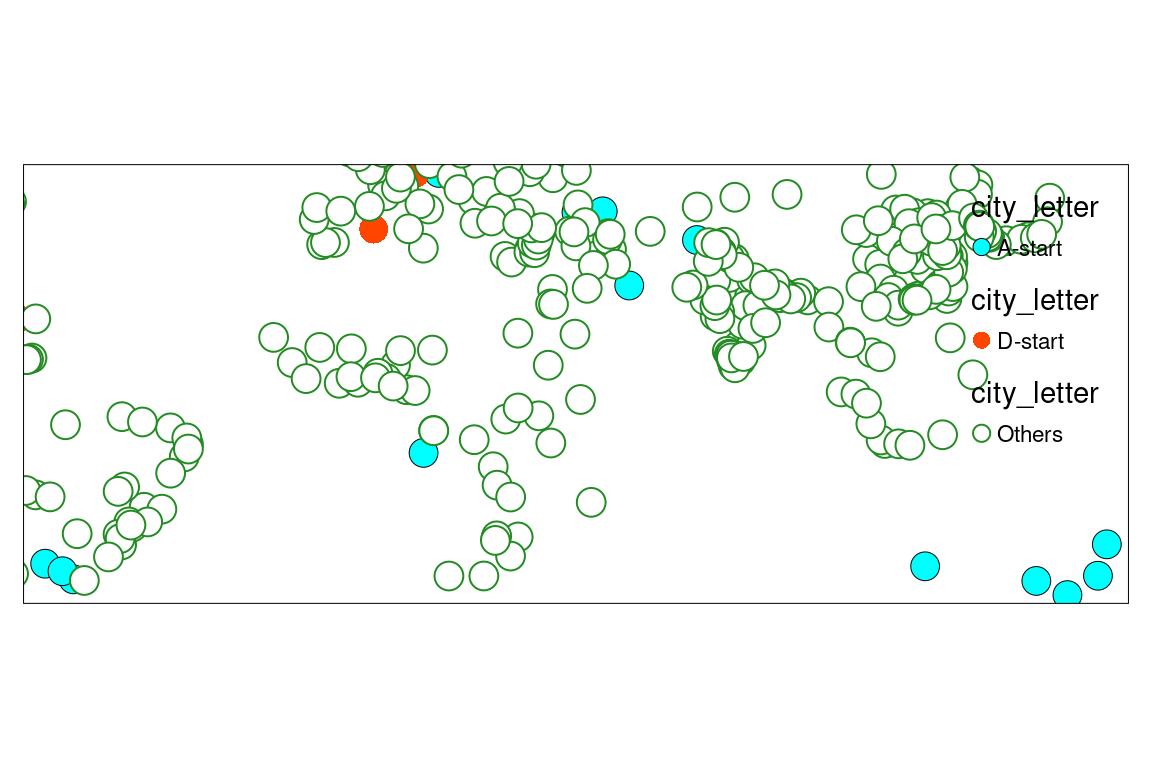
… or with the World behind.
tm_shape(World) +
    tm_polygons() +
  metro_small_symbology_borders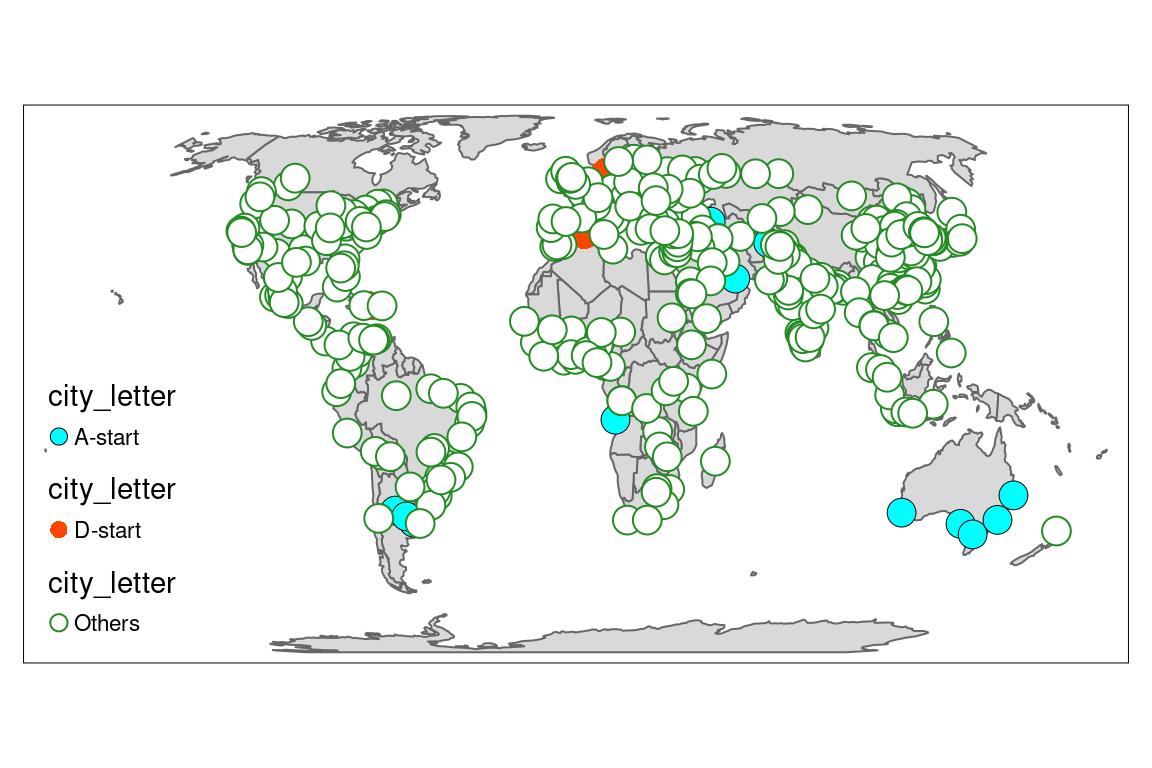
Deal with the legend
The problem with using multiple layers for a unique one is the legend is separated. Hence, we need to create our own with tm_add_legend() from our symbology.
tm_shape(World) +
    tm_polygons() +
  metro_small_symbology_borders +
  tm_add_legend(type = "symbol",
                title = "City Letter start",
                labels = symbology[["city_letter"]],
                col = symbology[["color"]],
                border.col = symbology[["border_color"]],
                border.lwd = symbology[["border_width"]]
  )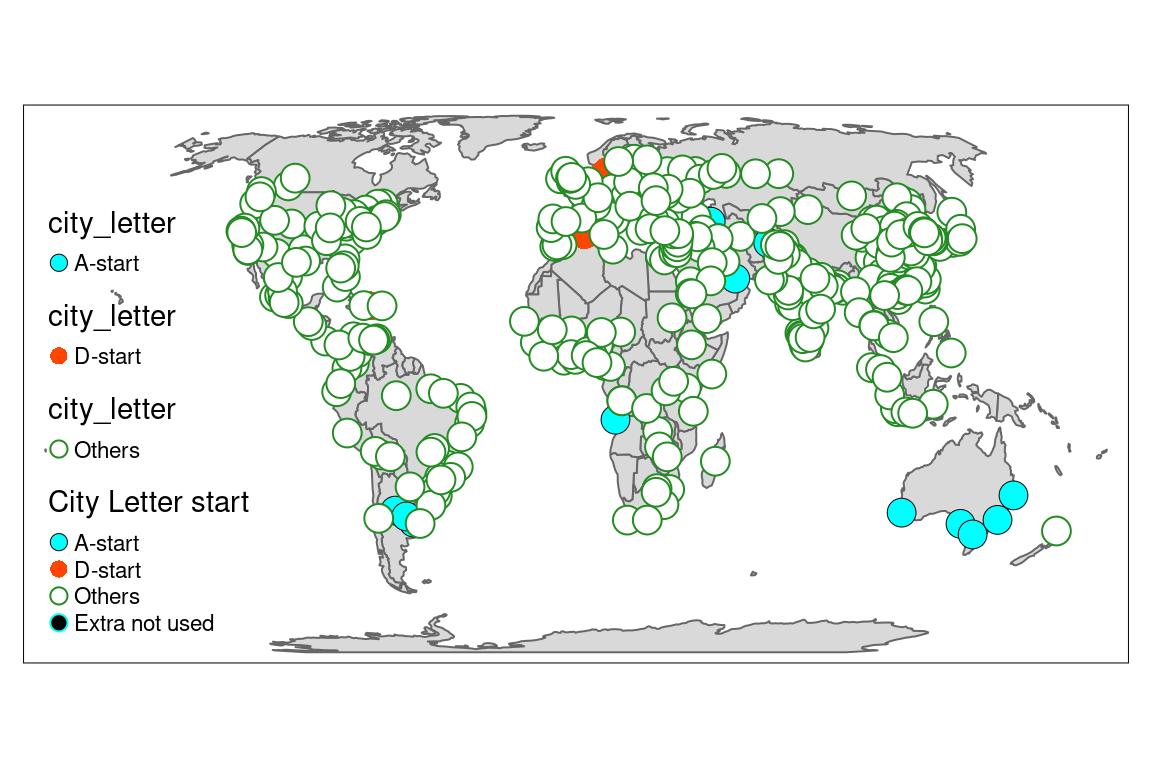
The final map with border colors and sizes
- We can create the legend from your layer, since not all levels of the symbology are used.
- We will also change the function to hide automatic legend from the 3 layers
#' A custom symbol layer with no legend
#'
#' @param data sf layer with column 'city_letter' at least
#' @param border_color A unique color value
#' @param border_width A unique width value
#' @param my_palette a named vector of colours associated to 'city_letter'
my_layer_point_border_no_legend <- function(data,
                                  border_color,
                                  border_width,
                                  my_palette) {
  tm_shape(data) +
    tm_symbols(col = "city_letter",
               palette = my_palette,
               border.col = border_color,
               border.lwd = border_width,
               legend.col.show = FALSE,
               size = 0.5)
}

# Full pipe creation of tmap layers
metro_small_tmap_layer <-
  metro_small_symbology %>%
  # nest
  nest(data = -c(border_color, border_width)) %>%
  # Calculate tmap shapes
  mutate(tm_layer =
           pmap(list(data, border_color, border_width), my_layer_point_border_no_legend, my_palette = my_palette)) %>%
  pull(tm_layer) %>%
  reduce(`+`)

# Create symbology from the original layer
layer_symbology <- metro_small_symbology %>%
  st_drop_geometry() %>%
  distinct(city_letter, color, border_color, border_width)

# Draw the map
tm_shape(World) +
    tm_polygons() +
  metro_small_tmap_layer + # layer with points
  tm_add_legend(type = "symbol",
                title = "City Letter start",
                labels = layer_symbology[["city_letter"]],
                col = layer_symbology[["color"]],
                border.col = layer_symbology[["border_color"]],
                border.lwd = layer_symbology[["border_width"]]
  )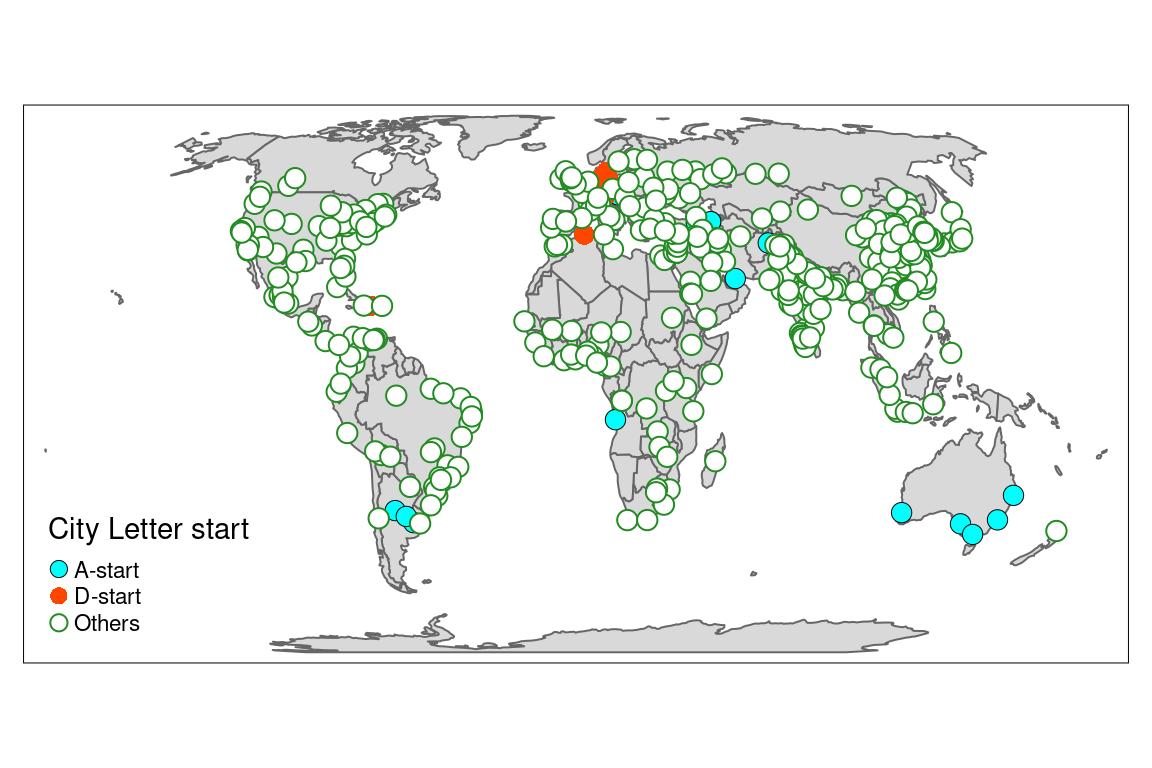
Et voilà !
See you later for other tips & tricks on maps or packages development…
Citation:
For attribution, please cite this work as:
Rochette Sébastien. (2022, Apr. 28). "Add {tmap} point layer with multiple symbol border colors and width". Retrieved from https://statnmap.com/2022-04-28-tmap-point-layer-with-multiple-symbol-border-colors-and-width/.
BibTex citation:
@misc{Roche2022Add{t,
    author = {Rochette Sébastien},
    title = {Add {tmap} point layer with multiple symbol border colors and width},
    url = {https://statnmap.com/2022-04-28-tmap-point-layer-with-multiple-symbol-border-colors-and-width/},
    year = {2022}
  }