A R package for covariates selection and species distribution modelling
I decided to transform into a R package some R-scripts I have been using for years for my studies with species distribution modelling. I know it could be improved in many ways, but this v0.1 works as is.
Please be kind for my first package ! And remember that it is a quick compilation of different codes, which have evolved for a few years (with other R standards…). But I am sure the R community will find many ways (and time?) to improve it.
This library has originally been created for covariates selection to predict species distribution (biomass, density or presence/absence). Its final aim is thus to produce maps of predicted distributions (Look at vignette SDM_Selection). However, the core of the library is a N-times k-fold cross-validation selection procedure that can be applied to any kind of data, provided that model parameters are well defined (Look at vignette Covar_Selection).
This works with dataframe, SpatialPointsDataFrame and tibbles.
This has been designed to run in parallel in multiple cores computer, using library parallel.
The only steps missing in SDMSelect library are data exploration and data cleansing. These are important parts of modelling and should be realized prior to model selection procedure.
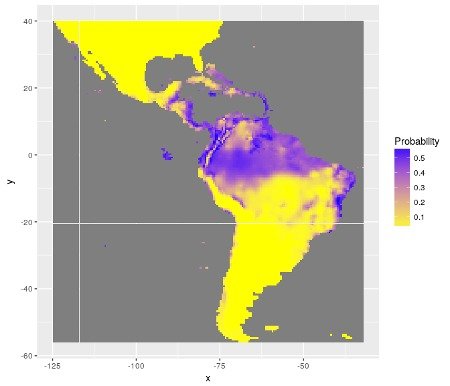
Figure 1: Distribution of probability of presence
Covariates selection method
The model selection procedure will test different combinations of covariates with LM, GLM, GLM natural splines and GAM models, with different distributions (Gaussian, Gamma, Log-Normal, Tweedie; Binomial) and with different maximum degrees of freedom for GLM with polynoms or natural splines.
The multiple k-fold cross-validation realised on the same folds for each model/submodel type allows their comparison using cross-validated RMSE or AUC. Covariates correlation can be tested prior to the selection procedure to avoid fitting models with correlated covariates. However, the cross-validation procedure is coupled with a forward stepwise procedure. This means that covariates are added to best models selected at the previous step. This obviously not choose a new covariate that add no predictive power to a model, thus avoiding selecting correlated covariates in the same model.
Models are ordered according to RMSE (or AUC for presence-absence). The cross-validation produces a distribution of (N*k) RMSE values for each model at each step. Models are ordered according to mean RMSE. RMSE distributions of model n°2 to n are then statistically (wilcoxon) compared to the best model. Models not statistically worse than the best model are retained for the next step. After the stepwise procedure, the best model among all is selected with the same method. Models not statistically worse are also identified.
Outputs
Outputs of the selection procedure are numerous, allowing for summary of the model selection and the comparison of the different models alltogether (GAM, GLM; Gaussian, Gamma, Log-Normal, Tweedie; Binomial). All output files and figures are stored in a common folder and are not showing up in the R session directly. The final model retained by the user can then be analysed (residual analysis, variance analysis, effect of covariates). For spatial data, maps of prediction can be produced.
Uncertainties
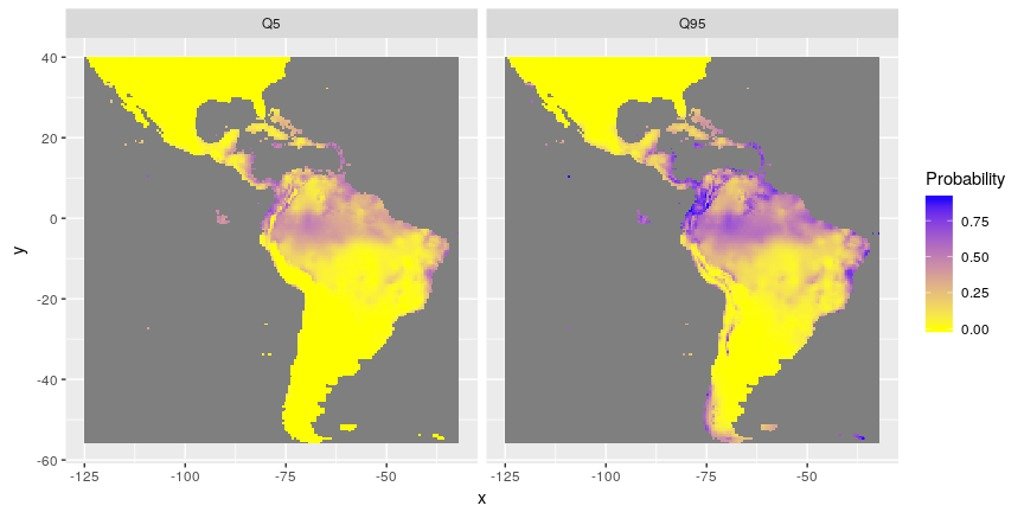
A particular attention has been given to assessment of uncertainty. Indeed, each prediction of a model is given with a standard error associated. This standard errors have been used to estimate possible minimum and maximum distributions of species (through estimations of quantiles).
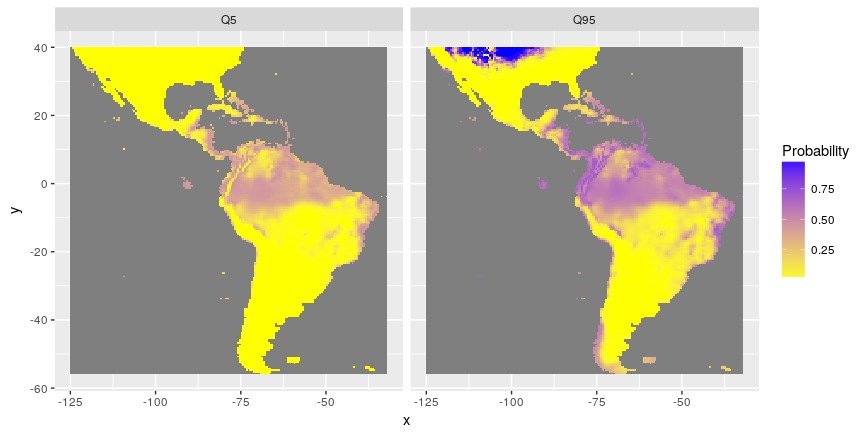
Figure 2: Distribution of minimum (quantile 5%) and maximum (quantile 95%) of probabilities of presence
Concerning presence-absence data, the estimation of probability of presence is not enough. The balance between presences and absences in data may conduct to biased predictions. The best threshold value to classify a probability of presence in presence or absence is here explored in more details. Map of probability to be over the threshold value is calculated.
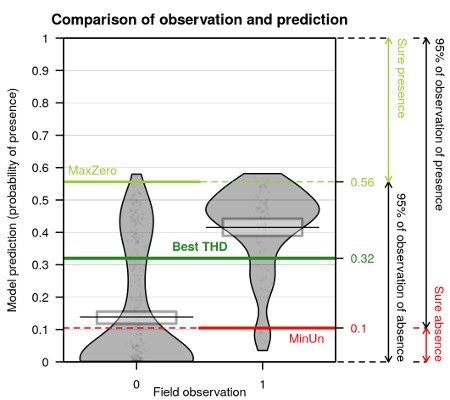
Figure 3: Comparison of predictions against observations in a presence-absence data model and thresholds values
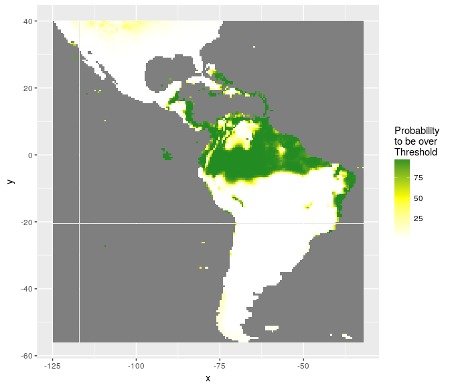
Figure 4: Distribution of probabilities to be over the best threshold value separating presences from absences
Caution
This library relies on a lot of other R-packages, which means that any modifications of those may prevent this library to work correctly. As I continue to use it regularly, I may see if some updates broke some of my functions and would try to fix them.
There are new key libraries in R like dplyr, tidyr, ggplot2 that did not originally exist when I first created these R-scripts. I now try to implement them from time to time.
Remark
This library is not as complete as can be library(caret) in terms of model types available, however, as far as I know, caret model selection procedure is designed for a unique combination of model/distribution. Here, cross-validation outputs of each model/distribution are kept, and can then be compared all together with paired comparison. Moreover, not only the model with the best mean RMSE (or AUC) is retained, but also all other models giving predictions statistically as good as the best one. For biological purpose, knowing all models with the same predictive power may modify outputs interpretation. Another difference is that SDMSelect package is designed for predicting species distribution models, which means that some outputs are maps of species distributions as well as all maps of uncertainty that can be deduced from model outputs.
Collaboration for species distribution modelling
For your work on covariates selection and species distribution modelling, you can contact me. Vignettes will give you a good starting point. I’ll be happy to participate to scientific collaborations based on this R-package. More information on my website https://statnmap.com.
If you want to participate in improving this library, please have a look at my todo list on github and feel free to clone, modify and provide pull requests on SDMSelect github repository.
How to cite
Please give credit where credit is due and cite R and R packages when you use them for data analysis. To cite SDMSelect properly, call the R built-in command citation("SDMSelect"):
Sébastien Rochette. (2018, October 8). SDMSelect: A R-package for cross-validation model selection and species distribution mapping (Version v0.1.4). Zenodo. http://doi.org/10.5281/zenodo.894344
Download and Install
Before installing SDMSelect, be sure to have updated versions of mgcv (>= 1.8-19) and dplyr (>= 0.7). Moreover, corrplot needs to be installed from github repository to get version taiyun/corrplot (>= 0.82): devtools::install_github("taiyun/corrplot").
To download the development version of the SDMSelect package, type the following at the R command line:
install.packages("devtools")
devtools::install_github("statnmap/SDMSelect")
To be able to see the vignettes, you will previously need to install knitr, rmarkdown, dismo and rasterVis, and install SDMSelectwith:
devtools::install_github("statnmap/SDMSelect", build_vignettes = TRUE, dependencies = c("Depends", "Imports", "Suggests"))Note that spatial libraries like rgdal and sp may require additional softwares to be installed on your computer if you work with Mac or Linux. Look how to install proj4, geos and gdal on your system.
Examples
I plan to write a few other posts to better explain the different functions of this library but the two vignettes included in the package show the main ones. Vignettes have been created to show how to use the library for covariate selection on simple cases (vignette(package = "SDMSelect")).
- First case is covariate selection procedure for classical dataset (not geographical data, nor species distribution data):
vignette("Covar_Selection", package = "SDMSelect"). You can read it on covar selection {pkgdown} page
- The second case is for spatial data of species occurence to produce predicted species distribution maps and maps of uncertainties:
vignette("SDM_Selection", package = "SDMSelect"). You can read it on SDM selection {pkgdown} page
Note that most figures of the vignette are saved in “inst” so that model selection is not run during vignette building. However, code in the vignettes can be run on your own computer and should return the same outputs. You can also find the path of the complete vignettes to be run on your computer with: system.file("Covar_Selection", "Covar_Selection.Rmd", package = "SDMSelect") and system.file("SDM_Selection", "SDM_Selection.Rmd", package = "SDMSelect"). Open and click knit button if you are on Rstudio. (This may require 5-10 minutes depending on the number of cores of your system).
Main functions are listed in the library general help: ?SDMSelect.
License
This package is free and open source software, licensed under GPL.
Acknowledgment
This work was partially allowed by my implication in the European Union’s Horizon 2020 research and innovation programme under grant agreement No 678760 (ATLAS). This output reflects only the author’s view and the European Union cannot be held responsible for any use that may be made of the information contained therein.
Citation:
For attribution, please cite this work as:
Rochette Sébastien. (2017, Sep. 23). "SDMSelect: Cross-validation model selection and species distribution mapping". Retrieved from https://statnmap.com/2017-09-23-sdmselect-package-species-distribution-modelling/.
BibTex citation:
@misc{Roche2017SDMSe,
    author = {Rochette Sébastien},
    title = {SDMSelect: Cross-validation model selection and species distribution mapping},
    url = {https://statnmap.com/2017-09-23-sdmselect-package-species-distribution-modelling/},
    year = {2017}
  }

